
Case Studies
Background Information
The development of diagnostic human cardiac catheterization for evaluation of patients with ischemia or infarction dates back to the early 1900s, though it required rigid catheters and fluoroscopic guidance which posed significant limitations due to the need to transport critically ill patients to the catheterization lab, the increased risk of inducing cardiac arrhythmias, and the requirement of remarkable catheter manipulation due to varying anatomy. Recognizing these difficulties and limitations as well as the need for an improved way to evaluate these seriously ill patients, in 1970, Swan et al. set out to find a more acceptable way of catheter placement. To meet their standard, there were 3 major criteria required: placement without induction of ventricular arrhythmias, quick and easy passage to the pulmonary artery, and placement without the need for fluoroscopy.
Similar to catheters used in dogs by Lategola and Rahn at the time, Swan et al. constructed a flexible flow-guided balloon catheter and tested 100 total catheter passages in humans, 60 without fluoroscopic guidance and 40 with fluoroscopic guidance. 92% of these 100 insertions passed into the pulmonary artery, no severe arrhythmias occurred, and the average passage time was 36 seconds which was much faster than with conventional catheters. Additionally, the insertion of these new catheters was able to be successfully completed by inexperienced staff, whereas conventional catheters required experienced personnel. Without fluoroscopic guidance, the average passage time was 49 seconds and 95% of passages enter the pulmonary artery which showed promise in the use of these catheters in severely ill patients who were unable to be transferred to the catheterization lab or in which fluoroscopy was not readily available.
The use of these catheters became widespread after this study, and the following new information changed the future by providing a more robust understanding of abnormal hemodynamics of acute cardiac conditions such as myocardial infarction, altering management of these patients, giving prognostic insight, and allowing for the monitoring of therapies that affect hemodynamics.
(Resources: Swan et al, Lategola & Rahn, and Mitchell’s Invasive Hemodynamic Monitoring)
Preload
- Cardiac preload is defined as the ventricular wall stress at the end of diastole via stretching of the cardiac myocytes, and, clinically, preload for the left ventricle is measured as the left ventricular end-diastolic volume.
- Increases in preload can be caused by increased ventricular compliance, increased atrial contraction, reduced heart rate providing more filling time, atrioventricular valve regurgitation, and increased central venous pressure via increased blood volume, increased skeletal pump activities, decreased venous compliance from sympathetic activation, and respiratory augmentation.
- Decreases in preload can be caused by impaired atrial contraction in the case of atrial arrhythmias, increased heart rate reducing filling time, atrioventricular valve stenosis, and decreased central venous pressure via decreased blood volume such as from dehydration or blood loss.
Afterload
- Afterload is the resistance the heart must overcome following systole, and, clinically is affected by aortic pressure and systemic vascular resistance.
- Changes in afterload are affected by the blood viscosity, the autonomic nervous system, and vasoactive hormones such as norepinephrine, epinephrine, angiotensin II, and vasopressin to name a few.
Contractility
- Contractility is the ability of the ventricle to contract at a certain preload and afterload. Unlike skeletal muscle that can change contractile force through changes in motor nerve activity and motor unit recruitment, cardiac muscle contraction involves activation of all muscle fibers. For this reason, contractile force can only be changed by varying the fiber length, which is dependent on preload, and changes in inotropy, which is the strength of contraction.
(Resources: hemodynamic adaptive mechanisms in heart failure)
The first step in inserting a Swan-Ganz catheter involves placing an introducer sheath into the right internal jugular vein, subclavian vein, or less commonly, the antecubital or femoral veins. After placement of the introducer sheath, the Swan-Ganz catheter is passed through and advanced into the central vein where the balloon is inflated with 1.5cc of air. The catheter is advanced slowly, with the balloon flowing through the right atrium, right ventricle, and pulmonary artery until there is a wedge position achieved in the distal branch of the pulmonary artery.
Physiologic Measurements and Interpretation
This is an accordion element with a series of buttons that open and close related content panels.
Preload/pulmonary artery wedge pressure
- Pulmonary artery wedge pressure is used to approximate left ventricular preload. Because proximal blood flow is occluded when the catheter is in the wedge position due to the inflated balloon, the distal catheter tip of the catheter is able to measure pressures distally in the pulmonary arterioles which closely approximates left atrial pressure. Subsequently, when the mitral valve is open at the end of diastole, this pressure approximates left ventricular end-diastolic pressure which is equal to the preload.
CO/Cardiac index
Thermodilution method
- This method uses a thermistor or thermocouple to continuously measure the temperature of blood in the heart. Typically, cold saline is injected into the right atrium which causes a drop in temperature of the blood. This produces a thermodilution curve, and the area under the curve is automatically calculated which is inversely related to CO.
Fick
- This method is based on the principle that oxygen delivery/consumption to the organs is the product of blood flow (or cardiac output) to the organs and the arteriovenous concentration difference of oxygen.
- O2 consumption (mL/min) = CO (L/min) x (A-V) concentration difference (mL/L)
- Therefore, if we solve for cardiac output, the Fick equation is
- CO (L/min) = O2 consumption (mL/min) / (A-V) concentration difference (mL/L)
- Things to know
- Arteriovenous difference:
- To find the A-V concentration difference, the A-V saturation difference must be multiplied by the theoretical O2-carrying capacity
- Theoretical O2-carrying capacity occurs when Hgb is 100% saturated
- Theoretical O2-carrying capacity = Hgb (g/dL) x 1.36 (mL/O2/g Hgb) x 10 dL/L
- Blood is drawn from the tip of the Swan-Ganz catheter to assess PA O2 saturation
- Ao O2 sat can be assessed with an oximeter or with arterial blood
- To find the A-V concentration difference, the A-V saturation difference must be multiplied by the theoretical O2-carrying capacity
- At rest, O2 consumption can be assumed to be 125 mL/m2
- Arteriovenous difference:
SVR
- Computed value using measurements from the PA catheter and blood pressure measurements
- SVR = (mean arterial pressure – right atrial pressure) / CO
- Mean arterial pressure = (1/3 x [systolic pressure – diastolic pressure]) + diastolic pressure
PVR
- Computed value using measurements from the PA catheter
- PVR = (mean pulmonary artery pressure – pulmonary capillary wedge pressure) / CO
Indications and Considerations
(Resources: bedside hemodynamic monitoring)
This is an accordion element with a series of buttons that open and close related content panels.
Indications
Shock
- Management of cardiogenic shock, especially in the setting of end-organ compromise
- Differentiate causes of shock and guide management after failing a trial of intravascular volume expansion
- Determine the presence of pericardial tamponade when clinical assessment is inconclusive and echocardiography is unavailable
Heart failure
- Differentiation of cardiogenic and noncardiogenic pulmonary edema after failing a trial of diuretic and/or vasodilator therapy
- Management of congestive heart failure refractory to standard medical therapy
Acute MI
- Diagnosis of mechanical complications of MI if echocardiogram has not been performed
- Progressive hypotension unresponsive to fluids post-MI
- Short-term guidance of management of acute mitral regurgitation before surgical correction
- Diagnosis of intracardiac shunts and severity of these shunts prior to surgical correction
Pulmonary hypertension
- Diagnosis and severity of pulmonary hypertension
Contra-indications
Absolute
- Right-sided endocarditis
- Mechanical tricuspid or pulmonic valves
- Presence of thrombus or tumor in the right side of the heart
Relative
- Coagulopathy
- Recent permanent pacemaker or defibrillator placement
- Left bundle branch block
- Bioprosthetic tricuspid or pulmonic valves
Common Interventions in Shock
(Resources: Inotropes and vasopressors, amboss)
This is an accordion element with a series of buttons that open and close related content panels.
Sympathomimetic drugs
Receptors
- Alpha-1: increases vascular smooth muscle contraction
- Beta-1: increases heart rate (chronotropy) and cardiac contractility (inotropy)
- Beta-2: increases vasodilation
- Dopamine-1: induces vasodilation in renal vasculature
Dobutamine
- Beta-1 > beta-2 >> alpha-1
- Inotropic effects > chronotropic effects
- No change or decrease in blood pressure, raises heart rate, increases cardiac output
Norepinephrine
- Alpha-1 > beta-1
- Increase in blood pressure (secondary to vasoconstriction) with possible reflex bradycardia
Epinephrine
- Alpha-1 > beta-1 (at high doses)
- Increases blood pressure, heart rate, and cardiac output
Dopamine
- D > beta-1 > alpha-1
- Low dose: greater beta-1 → increases heart rate and cardiac output
- High dose: greater alpha-1 → increases blood pressure
Phenylephrine
- Alpha-1 only
- Increased vasoconstriction → increased blood pressure with possible reflex bradycardia
Milrinone
- PDE3 inhibitor (beta-1/beta-2 like effect)
- In myocardium: phosphodiesterase type 3 inhibitor → increased cAMP → activation of calcium channels → cardiostimulatory effects → increased heart rate and inotropy
- In peripheral vasculature: phosphodiesterase type 3 inhibitor → increased cAMP → inhibition of myosin light chain kinase → smooth muscle relaxation → vasodilation
- Increased cardiac output and heart rate, unchanged or decreased blood pressure (decreased systemic vascular resistance)
Vasopressin
- Vasopressin-1 (alpha-1 like effect) → increased vasoconstriction → increase in blood pressure
Nitrates
Nitroprusside
- Nitric oxide → activation of guanylyl cyclase → increase cGMP → activation of protein kinase G
- Peripheral vasodilation → decreased preload and afterload
- Coronary dilation → improved myocardial perfusion
Nitroglycerin
- Nitric oxide → activation of guanylyl cyclase → increase cGMP → activation of protein kinase G
- Peripheral vasodilation (vein > arteries) → decreased preload and afterload
- Coronary dilation → improved myocardial perfusion
Fluids
- Giving fluids increases central venous pressure via increased blood volume, which then causes an increase in preload and subsequently, contractility
Lasix
- Giving Lasix decreases central venous pressure via decreased blood volume, which then causes a decrease in preload and subsequently, contractility
Beta blockers
- Inhibit beta-1 → decrease heart rate and cardiac contractility → decrease blood pressure
Table Summary
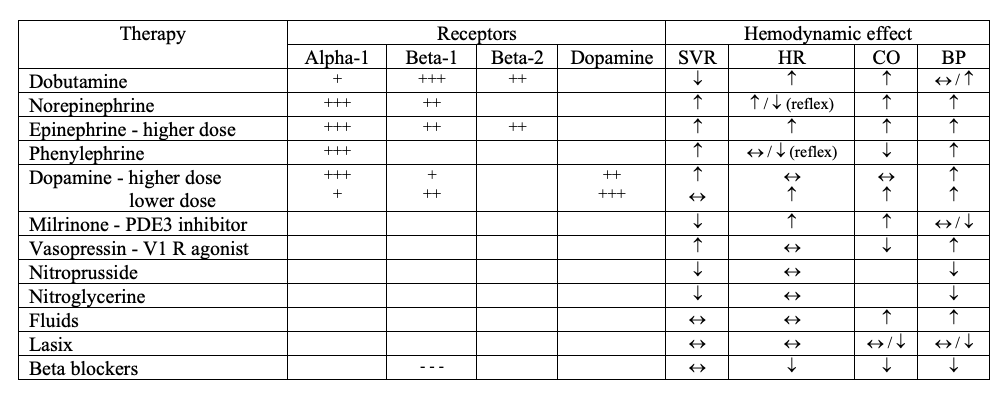
- Alpha-1: increases vascular smooth muscle contraction
- Beta-1: increases heart rate (chronotropy) and cardiac contractility (inotropy)
- Beta-2: increases vasodilation
- Dopamine-1: induces vasodilation in renal vasculature
Resources for Further Education
- Swan et al
- Bedside hemodynamic monitoring
- Invasive hemodynamic monitoring
- Lategola M, Rahn H: A self-guiding catheter for cardiac and pulmonary arterial catheterization and occlusion. Proc Soc Exp Biol Med 84:667-668, 1953
- Hemodynamic adaptive mechanisms in heart failure
- Inotropes and vasopressors